Performance Highlights
Five-Year Consolidated Financial Summary
| 2022/3 | 2023/3 | 2024/3 | 2025/3 | 2026/3 | |
|---|---|---|---|---|---|
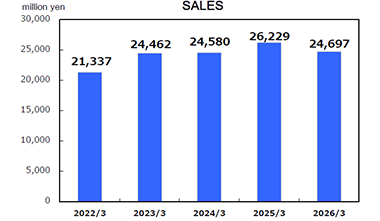
| Sales (million yen) |
21,337 | 24,462 | 24,580 | 26,229 | 24,697 |
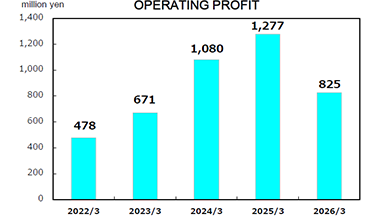
| Operating Profit (million yen) |
478 | 671 | 1,080 | 1,277 | 825 |
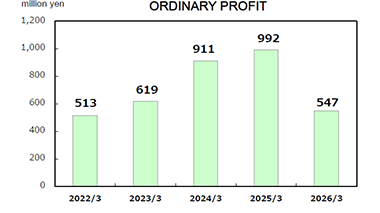
| Ordinary Profit (million yen) |
513 | 619 | 911 | 992 | 547 |
| Current Net Profit (million yen) |
289 | △ 485 | 604 | 614 | 78 |
| Total Assets (million yen) |
20,894 | 23,879 | 23,340 | 24,754 | 24,961 |
| Net Assets (million yen) |
7,395 | 7,446 | 8,461 | 10,100 | 10,137 |
| Total Issued Stocks | 14,624,000 | 14,624,000 | 14,624,000 | 14,624,000 | 14,624,000 |
| Current Net Profit / Stock (yen) | 20.18 | △ 33.78 | 41.91 | 42.37 | 5.37 |
| Assets / Stock (yen) | 501.72 | 502.53 | 569.55 | 676.53 | 677.93 |
| Dividend / Stock (yen) | 5.00 | 3.00 | 10.00 | 11.00 | 5.00 |
Sales
Operating Profit
Ordinary Profit
Current Net Profit

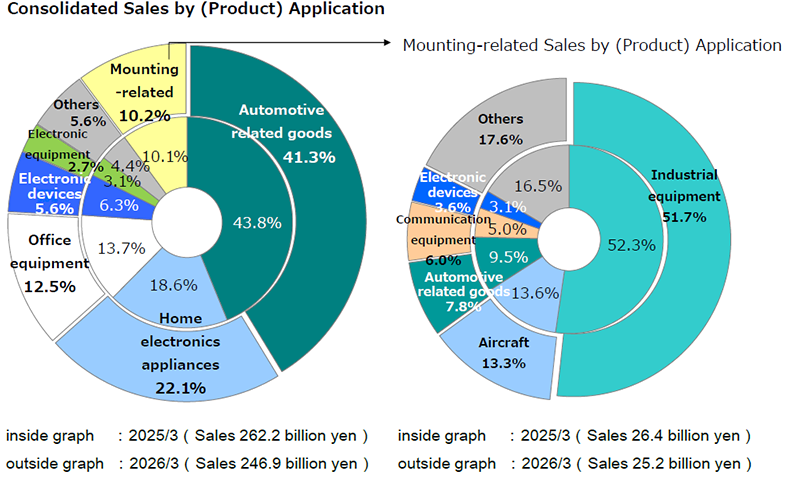
Sales by (Product) Application
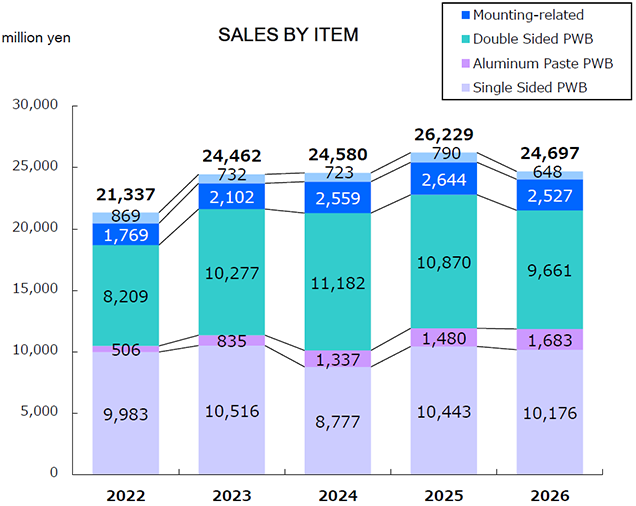
Sales by Item
| 2022/3 | 2023/3 | 2024/3 | 2025/3 | 2026/3 | |
|---|---|---|---|---|---|
| Single Sided PWB (million yen) | 9,983 | 10,516 | 8,777 | 10,443 | 10,176 |
| Aluminum Paste PWB (million yen) | 506 | 835 | 1,337 | 1,480 | 1,683 |
| Double Sided PWB (million yen) | 8,209 | 10,277 | 11,182 | 10,870 | 9,661 |
| Mounting-related (million yen) | 1,769 | 2,102 | 2,559 | 2,644 | 2,527 |
| Others (million yen) | 869 | 732 | 723 | 790 | 648 |
| Total (million yen) | 21,337 | 24,462 | 24,580 | 26,229 | 24,697 |