Performance Highlights
Five-Year Consolidated Financial Summary
| 2019/3 | 2020/3 | 2021/3 | 2022/3 | 2023/3 | |
|---|---|---|---|---|---|
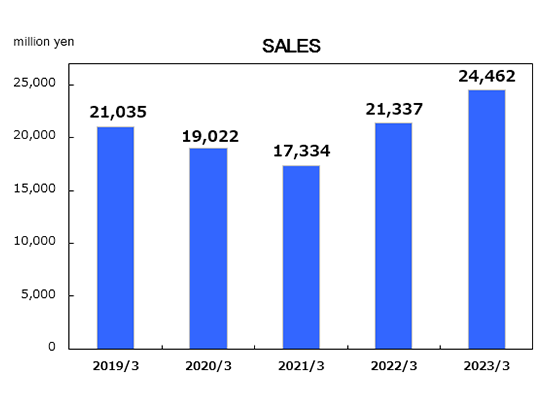
| Sales (million yen) |
21,035 | 19,022 | 17,334 | 21,337 | 24,462 |
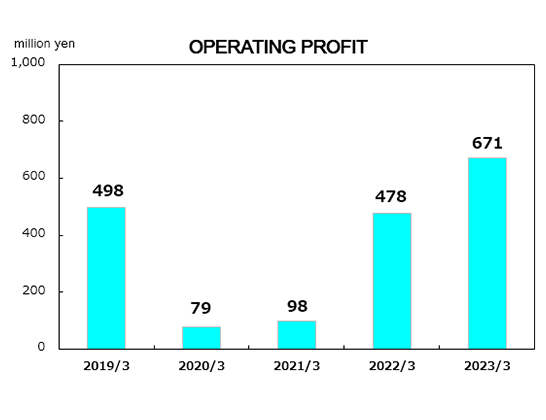
| Operating Profit (million yen) |
498 | 79 | 98 | 478 | 671 |
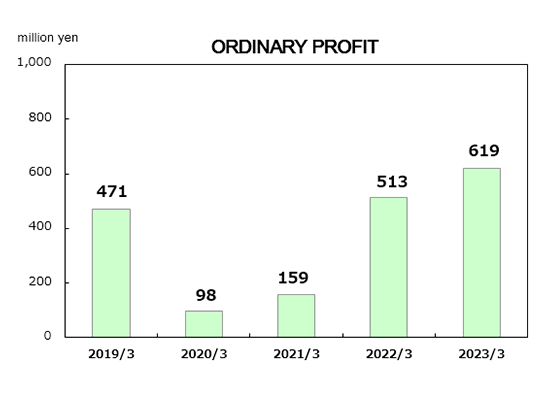
| Ordinary Profit (million yen) |
471 | 98 | 159 | 513 | 619 |
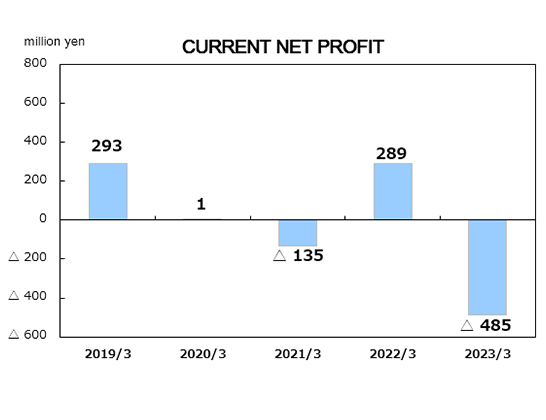
| Current Net Profit (million yen) |
293 | 1 | △ 135 | 289 | △ 485 |
| Total Assets (million yen) |
15,558 | 17,025 | 17,885 | 20,894 | 23,879 |
| Net Assets (million yen) |
6,887 | 6,616 | 6,433 | 7,395 | 7,446 |
| Total Issued Stocks | 14,624,000 | 14,624,000 | 14,624,000 | 14,624,000 | 14,624,000 |
| Current Net Profit / Stock (yen) | 20.48 | 0.08 | △ 9.46 | 20.18 | △ 33.78 |
| Assets / Stock (yen) | 471.18 | 452.82 | 434.76 | 501.72 | 502.53 |
| Dividend / Stock (yen) | 8.00 | 4.00 | 0.00 | 5.00 | 3.00 |
Sales
Operating Profit
Ordinary Profit
Current Net Profit
Sales by (Product) Application
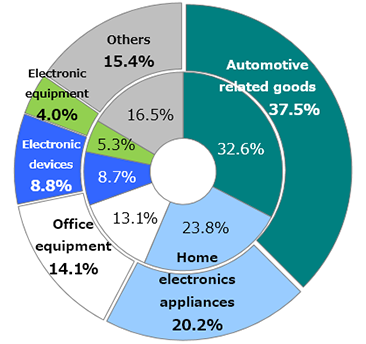 inside graph : 2022/3
outside graph : 2023/3
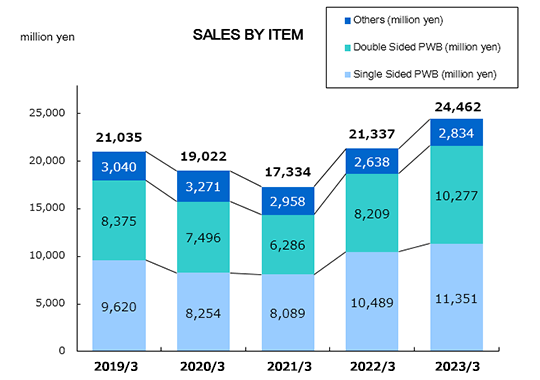
Sales by Item
| 2019/3 | 2020/3 | 2021/3 | 2022/3 | 2023/3 | |
|---|---|---|---|---|---|
| Single Sided PWB (million yen) | 9,620 | 8,254 | 8,089 | 10,489 | 11,351 |
| Double Sided PWB (million yen) | 8,375 | 7,496 | 6,286 | 8,209 | 10,277 |
| Others (million yen) | 3,040 | 3,271 | 2,958 | 2,638 | 2,834 |
| Total (million yen) | 21,035 | 19,022 | 17,334 | 21,337 | 24,462 |